The UK has lots of great national statistics available online, including “Renewable Electricity Generation by Local Authority”. This means the stats drill down into what is generated in each LA area (not what the LAs are responsible for generating themselves).
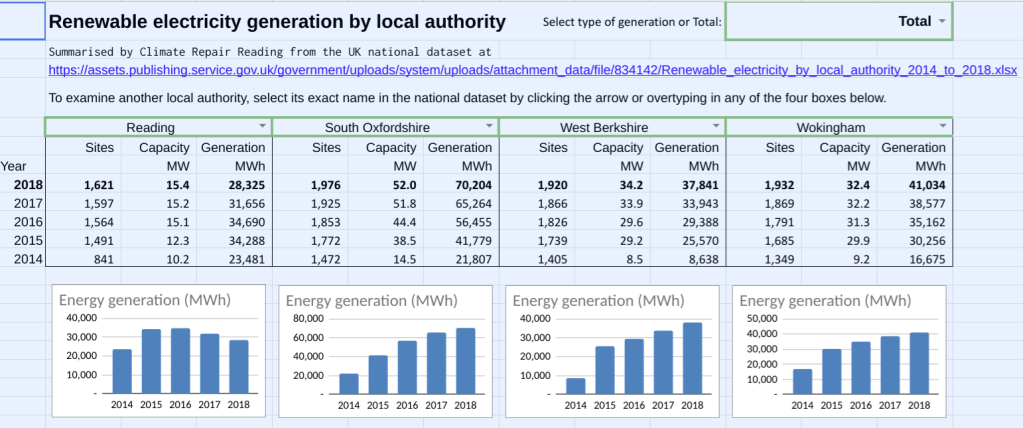
The raw numbers of the national statistics are time-consuming to interpret and understand. We wanted to understand Reading and district, so we consumed some of our time to produce a spreadsheet tool. We summarised data for Reading and its neighbouring authorities South Oxfordshire, West Berkshire and Wokingham.
This Is For Everyone
We have opened the tool for general use, as the climate emergency demands. You can choose to look at:
- Any other local authority area in Great Britain, though sadly not in Northern Ireland because the national source data is of poor quality.
- The total renewable electricity generation in each area.
- Each individual type of generation there, such as Photovoltaics (solar panels to you and me), Onshore Wind (turbines) and 10 others.
The spreadsheet is published in Google Sheets so that it should be readable in any decent web browser. You may find it slow to load at first because it must collect a ton of numbers in the background, but it should be fast enough after that. You can’t edit it, except for the input boxes outlined in green.
Have fun.
